Mostrando postagens com marcador Glide Slope. Mostrar todas as postagens

sábado, 18 de janeiro de 2025

JEJU AIR 7C2216 CVR and FDR LAST 4 MINUTES RECORDINGS OUT - POSSIBLE EVENT - CROSS BUS TIE RELAY NOT OPENED


On the very moment the GLIDE SLOPE is intercepted the CROSS BUS TIE RELAY automatically opens.


 The CROSS BUS TIE RELAY opens to isolate the navigation receivers and Flight Control Computers. The RELAY opening prevents all approach phase data be removed from FDR because of only one electrical failure.


The CROSS BUS TIE RELAY also opens when the BUS TRANSFER switch is moved to OFF.

 If NORMAL power sources to DC BUS fail, the emergency source of DC power is the batteries.

 If both generators come disconnected from the BUS TRANSFER BUS, the AUTOPILOT disengages and it can't be ENGAGED up to the generators are available. The plane must be piloted MANUALLY. It will be hard work.

With no electrical source available, the batteries can supply electrical power up to minimum of 60 minutes.

UPDATED UPON PRELIMINARY REPORT Jan 27, 2025


Cockpit Voice Recorder

The cockpit voice recorder uses four independent channels to record flight deck audio for 30 minutes or 120 minutes. Recordings older than 30 or 120 minutes are automatically erased. One channel records flight deck area conversation using the area microphone. The other channels record individual ACP output (headset) audio and transmissions for the pilots and observer. (Aircraft fit dependent) The RIPS (Recorder Independent Power Supply) provides power to the cockpit voice recorder for 10 minutes after aircraft power is interrupted either by normal shutdown or by any other loss of power. Normal power supply 115V TRANSFER BUS 2 and 28 V from DC BUS 2.

VOICE RECORDER Switch (when fitted):

AUTO - powers the cockpit voice recorder from first engine start until 5 minutes after last engine shutdown

ON - powers the cockpit voice recorder until the first engine start, then trips the switch to AUTO. On aircraft with no switch the voice recorder is active anytime 115V AC is applied to airplane.

As soon as the aircraft has intercepted the LOCALIZER course, following that the pilot attention will be on GLIDE SLOPE interception.

BATTERY POWER

Emergency source for:

- Static Inverter/AC Standby Bus

- DC Standby Bus

- Battery Bus

- Hot Battery Bus

- Switched Hot Battery Bus

The Static Inverter changes 24 DC power to 115 AC power for the AC STANDBY BUS.

The HOT BATTERY BUS is always connected to the battery, and all its components operate as long as the battery voltage is above a minimum value.

The pilot must move the BUS TRANSFER switch to OFF position and turn off the HIDRAULICS ELECTRIC PUMPS.

After trying to restore the generators, if both GEN OFF BUS (L & R) lights stay ON, the pilot must land the plane ASAP.


The CVR is a customer option, popular choices are the L-3 FA2100 and Honeywell 980-6020/980-6022. Both manufacturers offer these with a crash survivable memory unit (CSMU) for protection of the solid state voice recording memory. The capacity of the CSMU is a customer option, legally the state of registration may only need 30 minutes. The CSMU retains the most recent 30 or 120 minutes of audio, digital, and timing information. Unless you know the part number of the CVR installed, you will not know if it is a 30 minute or 120 minutes capacity, they look identical.

Another customer option is the overhead "Voice Recorder" switch, with ON and AUTO positions. If it has that switch it should shut down 5 minutes after the engines are shut down (based upon oil pressure), if it does not have that optional auto switch it can record whenever 115V is supplied.


quinta-feira, 28 de julho de 2022

LATERAL ERROR DURING LANDING


Conventional head-down display X Head-up display (HUD)

Source:

Örjan Goteman

Scandinavian Airlines Stockholm, Sweden


Kip Smith and Sidney Dekker

Department of Industrial Ergonomics Linköping Institute of Technology

References

Refer to FAA Advisory Circular 90-106A, issued 3/2/17

Nichol, Ryan J., “Airline Head-up Display Systems: Human Factors Considerations”. International Journal of Economics and Management Sciences, 4:248, May 3, 2015. https://www.omicsonline.org/open-access/airline-headup-display-systems-human-factors-considerations-2162-6359-1000248.php?aid=54170


AC No: 90-106A 2017

AC No: 20-167A 2016

AC No: 25-118 2014

AC No: 90-106A 2017


Third-generation aviation HUDs use optical waveguides that produce images directly in the combiner, without the need for a projection system. Some of the latest HUD systems use a scanning laser, which can display images and video on a clear transparent medium, such as a windshield.

It is possible that, during approach and landing, the HUD might affect the pilot’s ability to assimilate outside cues at the decision height, thereby reducing the success ratio for landings using an HUD.

HUD use reduced the width of the touchdown footprint in all tested visibility and lighting conditions, including visibility below the minimum allowed.

HUD use had no effect on the length of the touchdown footprint.

How ambient RVR affects approach and landing operations.

HUD USE IN COMMERCIAL FLIGHT OPERATIONS

A computer-generated aircraft flight-path and energy symbols presented onto a transparent screen in the pilot’s primary view.

HUDs replicate the information on the pilot’s conventional flight instruments, showing aircraft attitude, speed, altitude, and heading, and containing a flight-path symbol showing the aircraft velocity.

Conformal HUDs

A conformal HUD with a flight-path symbol can explicitly show the pilot where the aircraft is going relative to the surrounding world.

A pilot flying with conventional flight instruments must infer the aircraft’s flight path from a synthesis of the H-angle (Lintern & Liu, 1991), optical flow (Gibson, 1986), and possibly also the relative perspective gradient (Lintern, 2000).

Comparisons between HUDs and head-down displays in manual flight have found that conformal HUDs use improved track, speed, and altitude maintenance (Lauber, Bray, Harrison, Hemingway, & Scott, 1982; Martin-Emerson & Wickens, 1997).

The civil aviation community assumed that these HUD performance advantages over conventional head-down instrumentation could reduce the number of approach and landing incidents and accidents (Flight Safety Foundation, 1991).

Two well-documented problems associated with approach and landing: visual approaches to runways without radio navigation aids or with unreliable navigation aids, and the transition from instrument to external visual cues for landing in low visibility (e.g., Newman, 1995).

Pilot performance during landing in low-RVR conditions where transitioning from instrument to external cues for maneuvering is an issue.

The presumed sources for the advantage in flight-tracking performance for the HUD are that it eliminates the need for the pilot to move his or her gaze from head-down instruments to the outside world to look for maneuvering cues (Stuart, McAnally, & Meehan, 2003) and it minimizes scanning requirements (Mar[1]tin-Emerson & Wickens, 1997). The transition from head down to the outside world requires a change in visual accommodation (e.g., the visual depth of field changes from less than 1 m to infinity). Because conformal HUD symbology is focused at infinity, HUD use eliminates the need for and time demand of visual accommodation, simplifying the pilot’s task.

Cognitive tunneling

One possible negative effect of HUD in the landing situation is that inserting a glass plate with symbols in front of a pilot may affect his or her ability to visually acquire the approach lights, which is necessary to continue the approach below the decision height.

The light transmission through the HUD is not 100%. A commercial HUD will let about 85% to 90% of the incoming light pass through the glass plate. A detrimental effect of HUD use during the landing would then show up as a lower success ratio for HUD than for a conventional flight deck without HUD.

The segment of flight immediately before touch[1]down performed in U.S. and European civil air transport operation are conducted as Category I instrument landing system (ILS) approaches.

The two critical factors when making the decision of whether to land are the decision height and the RVR. Decision height refers to the aircraft’s vertical distance above the runway threshold where the pilot must make the decision to land or make a go-around.

The pilot must be able to see at least some of the approach or runway lights at the decision height.

The RVR is a measure of horizontal visibility defined by the length of visible approach and runway lights in the ambient atmospheric conditions. If the RVR is too low the pilot will not be able to see any of the approach lights at the decision height and must make a go-around.

Missed approach

It  is part of normal operations (and formal procedures), it adds an undesired additional risk(International Civil Aviation Organization [ICAO], 1993).

The approach light lengths differ from runway to runway. Geographical constraints sometimes make the standard full length of 720 m (Full Facilities) impossible to achieve. Fewer approach lights means less guidance and later contact with the approach lights during the approach.

For example, to commence a Category I ILS approach to a runway equipped with a 720 m length of approach lights, the RVR measured at the runway must not be less than 550 m (Federal Aviation Administration [FAA], 2002; Joint Aviation Authorities [JAA], 2004b). This RVR is expected to allow the pilot to see a visual segment of the ground that contains enough of the runway approach lights to judge the aircraft’s lateral position, cross-track velocity, and position in roll when the aircraft is at decision height.

Apart from the obvious effect that the approach lights will come in view later with lower RVR, other effects of shorter approach lights lengths could also come into play. If runway length has been shown to influence the perceived descent path (Lintern & Walker, 1991) it is also possible that a reduced length of approach lights can have similar effects, adding a source of uncertainty to the vertical control of the aircraft.

During landing the pilots have to concurrently process both outside cues and HUD cues to get any benefit from the HUD. The operational benefit from a reduction in touchdown variability could be that regulations would allow approach operations using HUD in lower than standard RVR conditions. The current operating minima were not set bearing HUD operations in mind and may be too restrictive for operations using HUD, a fact that the existing legislative text acknowledges (JAA, 2004b).

Setting RVR for approach too low will ultimately reduce approach success rate. In low RVR with very few external cues available at decision height, there is a risk that the pilots will focus their attention on the HUD symbology to the extent that they might not perceive the few visible approach lights at decision height. Pilots who do not pick up the out[1]side cues may thereby initiate a go-around when the approach actually could have been continued, an outcome that is not desirable from an operational stand[1]point.

The effect of HUD on touchdown performance for two different approach lights conditions as defined in the European regulations:

F     Full Approach Light facilities (≥ 720 m) and

b     Intermediate Approach Light facilities (420 to 719 m; JAA, 2004b).


EXPERIMENT 1

Experience on the B–737–700 varied from 50 hr to more than 1,000 hr.

It was used a CAE B–737–700 training simulator with aircraft aerodynamics and visual angles valid for B–737–700 to collect data. This six-axis full-motion simulator is approved for low-visibility operations down to an RVR of 200 m. The simulator’s visual system had a field of vision of 180°/40° with a focal distance greater than 10 m.

The HUD installed in the simulator was a Rockwell-Collins Flight Dynamics HGS–4000® (Head-up Guidance System), certified for low-visibility operations down to and including an RVR of 200 m. The HUD symbology and functionality used in the experiment met the production-line standard specification for the instrument meteorological conditions (IMC) mode used when conducting Cate[1]gory I ILS and non-precision approaches.


Forty-eight pilots from a major European airline volunteered to participate. All were qualified to fly the B–737–700 aircraft and had completed their HUD training for the operator. The HUD training sessions consisted of 1 day of theory and two simulator sessions of 4 hr duration each.

The HUD provided conformal display of flight path (velocity) and flight-path guidance. The flight path was displayed as a circle with slanted wings. Flight-path guidance was displayed in the form of a ring inside the flight-path symbol.

Flight-path guidance was not available in the conventional head-down instrumentation.

Each pilot manually flew two approaches using standard operating procedures of the airline. The scenarios started as a 6 nm final to the runway in lower than standard or standard RVR in a simulated 10 kt left crosswind. In the with-HUD condition, the pilots kept the aircraft on lateral and vertical by following the flight-path guidance ring with the flight-path symbol on the HUD. At 50 ft above the runway threshold, the guidance cue was automatically removed and the pilots performed the landing flare using external visual cues in conjunction with the HUD flight-path symbol. The HGS–4000® IMC mode incorporating automatic removal[1]of the guidance cue was deliberately chosen to ensure that the pilots could not attend solely to the HUD symbology in the with-HUD conditions.

In the no-HUD condition the pilots kept the aircraft on lateral and vertical track by following the flight director bar guidance. At decision height they continued the approach and landing using the external cues only.

Touchdown performance

11 of the 48 pilots con[1]ducted one or two go-arounds. The simulator failed to capture the location of the landing footprint for another 7 pilots. As a result the data set for comparing the touchdown footprints across the HUD and no-HUD conditions consists of 30 pairs of approaches. Of these 30, 15 were flown using the HUD in the first approach and 15 using the conventional head-down instruments (no-HUD) in the first approach;

15 were flown in standard RVR (550 m) conditions and 15 in lower than standard RVR conditions (450 m).

Lateral touchdown performance was measured as the absolute lateral deviation from the runway centerline at touchdown.


EXPERIMENT 2

Approaches in Experiment 2 were flown to simulations of a runway with 420 m of approach lights. This length falls within the intermediate facilities category of approach lights as defined by European aviation regulations (JAA, 2004b).

Each participant flew one approach with HUD and one approach without HUD to a runway with a system of approach lights of 420 m length. The between-subject variable was RVR at two levels, a standard minimum RVR (700 m) for intermediate facilities and a lower than standard minimum RVR (550 m to 600 m).

Forty-five [45] pilots from the same major European airline volunteered to participate. None of the volunteers had participated in Experiment 1. All were qualified to fly the B–737–700 aircraft and had completed their HUD training for the operator. Experience on the B–737–700 varied from more than 50 hr to more than 1,000 hr.

Each of the 45 pilots attempted two approaches.

Thirty-two made two successful landings, one with HUD and one without. Four pi[1]lots made go-arounds in both conditions. Three pilots landed with the HUD and made go-arounds without the HUD; six pilots landed without the HUD and made go-arounds with the HUD.

Touchdown performance

As a result, the data set for comparing the touchdown footprints across the HUD and no-HUD conditions consists of 28 pairs of approaches. Of these 28 pairs of approaches, 9 were flown using the HUD in the first approach and 19 using the conventional head-down instruments (no-HUD) in the first approach; 14 were flown in standard RVR (700 m) conditions and 14 in lower than standard RVR conditions.

As in Experiment 1, the effect for HUD use on the lateral component of the touch[1]down footprint is strong, F(1, 26) = 14.9, p < .001, η2 = .10, indicating a power greater than .70. Once again, landings were closer to the centerline when pilots used the HUD.

Three findings:

111. HUD use per se did not influence the pilots’ decision to land or go-around at the decision height.

The lack of an effect of HUD suggests that the additional information in the HUD did not distract the pilots’ attention or interfere with their decision making during the most critical portion of the approach and landing sequence.

2.2.HUD use significantly reduced the size of the lateral component of the touchdown footprint for all RVR conditions.

The difference between the HUD and the no-HUD conditions lay in the presence of a conformal flight-path vector in the pilots’ primary field of view during the landing.

3.3.In contrast to its effect on the lateral component of the touchdown footprint, it appears that the HUD did not influence the size of the longitudinal footprint.

The ubiquitous and ever-varying direction and velocity of wind is likely to preclude the development of true automaticity at touch[1]down. Crosswinds introduce an element of uncertainty regarding drift (the shift in lateral location of the aircraft relative to the runway’s centerline). For the pilot to detect drift the visual ground segment needs to be long enough to determine the aircraft’s movement over the ground. That means that to detect drift at all, a notice able lateral displacement must take place and not all of this displacement can be corrected before touchdown.

The HUD largely eliminates uncertainty about drift.

The addition of a conformal flight-path vector projected over the runway provides instantaneous feedback about aircraft drift and actual flight path. The additional information enables precise control of the flight path during approach and landing and reduces the variance in lateral displacement practically to nil.

Control of the longitudinal component of the touchdown footprint is largely an effect of how pilots handle the aircraft’s energy (operationally manifested as sink rate) in the final seconds before landing. The pilot uses information provided by the optic flow from the looming runway to control the aircraft’s energy (Lee, 1974). It is important to note that pilots of large commercial air transport aircraft are also aided by radio altimeter callouts that count down from 50 ft to 0 ft (runway contact) in 10-ft decrements.

The initiation of the landing flare has been shown to be a function of time to contact (Mulder, Pleijsant, van der Vaart, & van Wieringen, 2000). A small change in the timing of a landing flare at the nominal glide slope of 3° results in large longitudinal differences. The HUD mode used in the experiments provided no flare guidance and no additional information that could be used to guide the pilots when to initiate the landing flare.


quarta-feira, 28 de abril de 2021

WHEN WILL WE START THE FLARE - Three Case Studies


ENGLISH

PORTUGUÊS

The above gif was taken when for a minute of simulation from the 900 seconds to the 960 seconds. It shows tracks identified as safe in cyan and tracks identified as anomalous in yellow. This identification is done at every simulation step as can be seen for track 3661.


O gif acima foi tomado quando para um minuto de simulação a partir de 900 segundos até os 960 segundos. El mostra trajetórias identificadas como seguras em ciano e trilhas identificadas como anômalas em amarelo. Esta identificação é feita em cada etapa de simulação, como pode ser visto para a faixa 3661.


WHEN WILL WE START THE FLARE

·         Source: Airbus Safety

Contributors:

-    Raimund GEUTER Expert Pilot Flight Operations Support

-    Sundeep GUPTA Accident/Incident Investigator Product Safety

-    Thomas LEPAGNOT Accident/Incident Investigator Product Safety

-    Marc LE-LOUER A300/A310 Flight Operations Support Engineer Customer Support

-    Xavier LESCEU,  Andris LITAVNIKS and Christian PAQUIN-LAVIGNE

-    Airbus Canada.

Source: National Aviation University, Kyiv, Ukraine.

PROCEEDINGS, THE SIXTH WORLD CONGRESS, "AVIATION IN THE XXI CENTURY", “Safety in Aviation and Space Technologies”.

E. O. Kovalevskiy, candidate of engineering

V.V. Konin, Doctor of Engineering

T.I. Olevinska, post-graduate student

Source: James Albright, retired U.S. Air Force pilot with time in the T-37B, T-38A, KC-135A, EC-135J (Boeing 707), E-4B (Boeing 747) and C-20A/B/C (Gulfstream III).

Source: Math Works, MATLAB for Artificial Intelligence.

Source: Vernier, Airliner Takeoffs and Landing with Graphical Analysis


 Two methods of aircraft flare are considered:

a) fixation of touchdown point and altitude exponential step     change.

b)     step change of trajectory slope.

In both cases gradual descending of height and vertical speed was achieved.

 Landing is divided into linear decrease on the glide slope and maneuver of flare, in which aircraft is moving by the exponential trajectory.

 For a trajectory coming to land at Boston Logan International airport (KBOS) on runway 22L to be safe, the trajectory must satisfy the following rules:

  •   The trajectory must be closely aligned with the runway          direction.
  •   The glide slope must be between 2.5 and 4 degrees in the last 20963 meters. At distances above 20963 meters, the altitude must be at least 3000 ft.
  •   The speed must be between 120 knots and 180 knots at the landing point. The upper speed bound can increase linearly with distance from the landing point.

 Below a graph illustration for Boeing 737’s takeoff and landing.


FIRST CASE STUDY: Airbus

BOUNCED LANDING

NOSE LANDING GEAR IMPACT AND

A TAIL STRIKE ON GO-AROUND

 An A320 was on the final approach segment of its ILS approach, configured for landing (CONF FULL).

The Pilot Flying (PF) disconnected the autopilot at 370 ft Radio Altitude (RA) and kept autothrust ON. At 200 ft, tailwind variations caused the airspeed to drop below approach speed (Vapp).


Operational Considerations

 Role of the Pilot Monitoring (PM)

The FCOM SOP for landing requests a SPEED callout by the PM in the case of speed deviation of 5 kt below the target speed. The PF should initiate a go-around unless they consider that a stabilized condition can be recovered by small corrections to the aircraft and within sufficient time prior to landing.

The FCTM states that the risk of tail strike is increased due to the high angle of attack and high pitch attitude if the speed of the aircraft is allowed to decrease too far below Vapp before the flare.

Looking at step in the event described above, it shows the speed went below Vapp -5 kt from 100 ft and below. If the PM had made a “SPEED” callout then the PF may have noticed the speed decay and attempted to correct it or initiate a go-around if it was not likely to stabilize in time.


Flare Height

The FCOM states that in a stabilized approach, the flare should be initiated at 30 ft for A320 family aircraft (the values for other Airbus aircraft are provided later in this article).

The FCTM recommends initiating the flare earlier if there is a tailwind. This is because a tailwind will contribute to a higher ground speed with an associated increase in vertical speed to maintain the approach slope.

Initiating the flare earlier would have reduced the high vertical speed of the aircraft in the event described above.

Thrust Lever Management

The A320 FCTM explains that the flight crew can rapidly retard all thrust levers to IDLE either earlier or later than the 20 ft “RETARD” auto callout reminder depending on the conditions. However, the thrust levers should be at IDLE by touchdown to ensure that the ground spoilers will extend and keep the aircraft on the ground.

In step of the event, the PF pushed the thrust levers above the CLB detent during flare. This increased thrust and inhibited the ground spoiler extension during the initial touchdown, which contributed to the aircraft bounce.

Bounce Management

For a high bounce, as was the case in the incident described above, the FCTM recommends maintaining the aircraft’s pitch attitude and performing a go-around.

The hard impact of the nose landing gear with the runway described in step of the event was caused by extension of the ground spoilers when the thrust levers were retarded to IDLE during the bounce combined with a full forward stick input after the bounce.

 Go-Around Close to the Ground

The FCTM recommends avoiding an excessive rotation rate during a go-around close to the ground and to counteract any pitch-up effect due to the thrust increase.

In step of the event, it was the full back stick input combined with the nose landing gear bounce and thrust increase that contributed to the tail strike.


RECIPE FOR A SAFE LANDING

The recommendations below summarize the procedures and techniques provided in the FCOM and FCTM.

Be stabilized

A safe flare can only be achieved when the aircraft is stabilized, meaning that all of the flight parameters areas expected, including:

- the aircraft is on its expected final flight path (lateral and vertical)

- speed is close to Vapp, and

- wings are level.

If the aircraft reaches the flare height at the correct speed and it is on the expected flight path, then a normal flare technique will lead to a safe landing.

PM must call out any flight parameter deviation

Careful monitoring of the flight parameters including speed, pitch, bank and vertical speed, enables the PM to raise the attention of the PF to any deviation during the final approach. This will enable the PF to respond accordingly and initiate a go-around, if required.

Refer to the FCOM SOP for Approach for more information about the PM callout related to the flight parameter deviation threshold.


Flare at the right time

Flare should be initiated at around:

·         30 ft RA (A220/A300/A310/A320) or

·         40 ft RA (A330/A340/A350/A380) in stabilized conditions.

 Factors that may require an earlier initiation of the flare:

- Steeper approach slope (more than the nominal 3º)

- Increasing runway slope or rising terrain before the runway threshold

- Tailwind

- High airport elevation.


SECOND CASE STUDY: National Aviation University, Ukraine


The bottom line is fixation of flare beginning point coordinates (xf, hf) and touchdown point coordinates (xtd, htd).

(xg, hg) – glide slope beginning point, (xg0, hg0) – is a fictitious point on the ground on which glide path is projected, (x, hc) – is a final point of flare which is chosen in such way, that the exponent of flare trajectory intersects the ground at the touchdown point.

Two stages for reaching desired horizontal and vertical speed at touchdown point (xtd).

First stage

Decreasing horizontal speed W up to desired value Wz from point xg to point xf while height is on level hf = hz.

Second stage

Fixing the horizontal speed and begin to change the height by the exponential law from the value hz – hс to the value hс in such a way, that the exponent line crosses the point xtd with the vertical speed of hp.

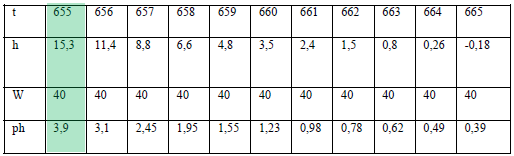
The input data for Math modeling is:

Horizontal speed: Wz=40 m/s;

Desired vertical speed in touchdown point (point where h=0): phz=0.5 m/s;

Initial trajectory slope angle in radians: γ0 =0.097;

Flare beginning height: hz=15 m.

Flare begins at the moment: t=655 s.

The trajectory slope angle change from the flare beginning by the height change law, the vertical speed change law and the flare period equation.


FROM INPUT DATA

Height and vertical speed calculation


The first method provides more accurate touchdown.

It is the fixation of touchdown point and altitude exponential step change.

THIRD CASE STUDY: James Albright

A G450’s flight path vector at 10 ft. on a short runway (KBED Runway 23). By James Albright.


“I find that raising my eyes to the end of the runway, but below the horizon, does the trick. The photo shows the flight path vector (symbology that shows the aircraft’s trajectory) slightly below the end of the runway because I was looking at the runway’s end, not the horizon. If I sense the airplane has leveled off, I’ll nudge the stick forward with the thought, “Keep it coming down.” This assures the aircraft continues to descend. Even without flight path vector technology, the pilot needs only to shift his or her eyes to the end of the runway to keep the descent rate going. But there is a little more to it than that, and for that we need to look at some timing.”

G650’s flare path starting at 25 ft

When we begin the flare, the MLG will be at 25 ft. and the pilot’s eyes 14.5 ft. higher. The aimpoint will be 39.5 ft. / tan(3deg.) = 754 ft. away. Since the MLG have to travel an additional 42 ft., we know the distance of the flare will be a total of 796 ft. If we assume a ground speed of 120 kt., the flare will take:


The flare can be learned scientifically by instilling the need to begin at a consistent height, pulling back at a consistent rate, and with your eyes pointed at the end of the runway. Each event should be graded looking for a 4-sec. rotation to flare, ending with the wheels touching at the desired aimpoint.


How to Land an Airplane, in Summary

(1) Fly a stable approach, on speed, on the proper glidepath.

(2) Cross the runway threshold at 50 ft. visually or electronically. Remember that if flying visually or on an ILS glideslope, your wheels will be lower than 50 ft. (In our example, that was 35.5 ft. when flying visually.)

(3) Determine the proper flare height based on any flight manual data or on what you have determined by experience. This height can be made evident by electronic means, such as a radio altimeter, but should always be backed up with a point on the runway that you expect to just disappear under the nose. (In our example, a point 600 ft. short of the aimpoint.)

(4) At the proper flare height, shift your eyes to the end of the runway (not the horizon), and using one smooth and continuous motion, pull back to your flare rotation pitch. The pull should take 4 sec. and should end as the wheels touch with the aircraft still in a 100- to 200-fpm descent rate.

Notice that we have not mentioned thrust at all, which will be handled in accordance with aircraft-specific procedures. My technique is to allow the autothrottle “retard” function, if available, to function as designed. This further reduces the number of variables. If operating without autothrottles, I attempt to initiate the reduction at the same time I initiate the pitch rotation, reaching idle as the wheels touch. This has worked on every aircraft I have flown, but I recognize it will not work for others.

One last note for those flying aircraft with unpublished eye-to-wheel and flare heights. The math shown here is for a Gulfstream G650, an aircraft in the 100,000-lb. range that is nearly 100 ft. long. Using a 25-ft. flare height will probably be conservative for smaller aircraft but will give you a starting point. (Remember larger aircraft may have flare heights around 30 ft.) I recommend trying these out in the simulator or seeing what you have been doing in the airplane as a comparison. The first step in any scientific endeavor is observation. I believe you can improve your landings if you approach the landing flare as science, not art.

Factors that may require an earlier flare

Flare should be initiated at around:

30 ft RA (A220/A300/A310/A320) or

40 ft (A330/A340/A350/A380) in stabilized conditions.

“The PF must avoid forward stick inputs once flare is initiated.”

Any forward stick input after flare is initiated will increase the risk of landing on NLG with hard impact.

The PF must start the flare with a positive and prompt back pressure on the control column to break the descent rate. The PF must then maintain a constant and positive back input on the control column until touchdown.


Retard! Retard! Retard! Retard!

For A320/A330/A340/A350/A380 aircraft

The 20 ft “RETARD” auto callout is a reminder, not an order. The PF can retard the thrust levers earlier or later depending on the conditions.

The PF must ensure that the thrust levers are at idle in any case, by touchdown at the latest, to enable automatic extension of the ground spoilers.”

In the case of a bounce - Maintain the aircraft pitch


HIGH BOUNCE

·         Maintain pitch

·         Apply go-around thrust

·         Counteract any pitch-up tendency (because of THRUST INCRESE. That will avoid TAILSTRIKE).