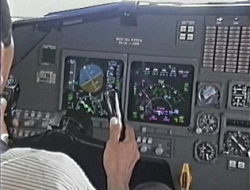
Conventional
head-down display X Head-up display (HUD)
Source:
Örjan
Goteman
Scandinavian
Airlines Stockholm, Sweden
Kip Smith
and Sidney Dekker
Department
of Industrial Ergonomics Linköping Institute of Technology
References
Refer to
FAA Advisory Circular 90-106A, issued 3/2/17
Nichol, Ryan J., “Airline Head-up Display Systems: Human Factors Considerations”. International Journal of Economics and Management Sciences, 4:248, May 3, 2015. https://www.omicsonline.org/open-access/airline-headup-display-systems-human-factors-considerations-2162-6359-1000248.php?aid=54170
AC No: 90-106A 2017
AC No: 20-167A 2016
AC No: 25-118 2014
AC No: 90-106A 2017
Third-generation aviation HUDs use optical waveguides that
produce images directly in the combiner, without the need for a projection
system. Some of the latest HUD systems use a scanning laser, which can display
images and video on a clear transparent medium, such as a windshield.
It is possible that, during approach and landing, the HUD
might affect the pilot’s ability to assimilate outside cues at the decision
height, thereby reducing the success ratio for landings using an HUD.
HUD use reduced the width of the touchdown footprint in all
tested visibility and lighting conditions, including visibility below the
minimum allowed.
HUD use had no effect on the length of the touchdown
footprint.
How ambient RVR affects approach and landing operations.
HUD USE IN COMMERCIAL FLIGHT OPERATIONS
A computer-generated aircraft flight-path and energy symbols
presented onto a transparent screen in the pilot’s primary view.
HUDs replicate the information on the pilot’s conventional
flight instruments, showing aircraft attitude, speed, altitude, and heading,
and containing a flight-path symbol showing the aircraft velocity.
Conformal HUDs
A conformal HUD with a flight-path symbol can explicitly
show the pilot where the aircraft is going relative to the surrounding world.
A pilot flying with conventional flight instruments must
infer the aircraft’s flight path from a synthesis of the H-angle (Lintern &
Liu, 1991), optical flow (Gibson, 1986), and possibly also the relative
perspective gradient (Lintern, 2000).
Comparisons between HUDs and head-down displays in manual
flight have found that conformal HUDs use improved track, speed, and altitude
maintenance (Lauber, Bray, Harrison, Hemingway, & Scott, 1982;
Martin-Emerson & Wickens, 1997).
The civil aviation community assumed that these HUD performance
advantages over conventional head-down instrumentation could reduce the number
of approach and landing incidents and accidents (Flight Safety Foundation,
1991).
Two well-documented problems associated with approach and
landing: visual approaches to runways without radio navigation aids or with unreliable
navigation aids, and the transition from instrument to external visual cues for
landing in low visibility (e.g., Newman, 1995).
Pilot performance during landing in low-RVR conditions where
transitioning from instrument to external cues for maneuvering is an issue.
The presumed sources for the advantage in flight-tracking
performance for the HUD are that it eliminates the need for the pilot to move his
or her gaze from head-down instruments to the outside world to look for
maneuvering cues (Stuart, McAnally, & Meehan, 2003) and it minimizes
scanning requirements (Mar[1]tin-Emerson
& Wickens, 1997). The transition from head down to the outside world requires
a change in visual accommodation (e.g., the visual depth of field changes from
less than 1 m to infinity). Because conformal HUD symbology is focused at
infinity, HUD use eliminates the need for and time demand of visual accommodation,
simplifying the pilot’s task.
Cognitive tunneling
One possible negative effect of HUD in the landing situation
is that inserting a glass plate with symbols in front of a pilot may affect his
or her ability to visually acquire the approach lights, which is necessary to continue
the approach below the decision height.
The light transmission through the HUD is not 100%. A
commercial HUD will let about 85% to 90% of the incoming light pass through the
glass plate. A detrimental effect of HUD use during the landing would then show
up as a lower success ratio for HUD than for a conventional flight deck without
HUD.
The segment of flight immediately before touch[1]down
performed in U.S. and European civil air transport operation are conducted as
Category I instrument landing system (ILS) approaches.
The two critical factors when making the decision of whether
to land are the decision height and the RVR. Decision height refers to the
aircraft’s vertical distance above the runway threshold where the pilot must
make the decision to land or make a go-around.
The pilot must be able to see at least some of the approach
or runway lights at the decision height.
The RVR is a measure of horizontal visibility defined by the
length of visible approach and runway lights in the ambient atmospheric
conditions. If the RVR is too low the pilot will not be able to see any of the approach
lights at the decision height and must make a go-around.
Missed approach
It is part of normal
operations (and formal procedures), it adds an undesired additional risk(International
Civil Aviation Organization [ICAO], 1993).
The approach light lengths differ from runway to runway.
Geographical constraints sometimes make the standard full length of 720 m (Full
Facilities) impossible to achieve. Fewer approach lights means less guidance
and later contact with the approach lights during the approach.
For example, to commence a Category I ILS approach to a
runway equipped with a 720 m length of approach lights, the RVR measured at the
runway must not be less than 550 m (Federal Aviation Administration [FAA],
2002; Joint Aviation Authorities [JAA], 2004b). This RVR is expected to allow
the pilot to see a visual segment of the ground that contains enough of the
runway approach lights to judge the aircraft’s lateral position, cross-track
velocity, and position in roll when the aircraft is at decision height.
Apart from the obvious effect that the approach lights will
come in view later with lower RVR, other effects of shorter approach lights
lengths could also come into play. If runway length has been shown to influence
the perceived descent path (Lintern & Walker, 1991) it is also possible
that a reduced length of approach lights can have similar effects, adding a source
of uncertainty to the vertical control of the aircraft.
During landing the pilots have to concurrently process both
outside cues and HUD cues to get any benefit from the HUD. The operational
benefit from a reduction in touchdown variability could be that regulations
would allow approach operations using HUD in lower than standard RVR
conditions. The current operating minima were not set bearing HUD operations in
mind and may be too restrictive for operations using HUD, a fact that the
existing legislative text acknowledges (JAA, 2004b).
Setting RVR for approach too low will ultimately reduce
approach success rate. In low RVR with very few external cues available at
decision height, there is a risk that the pilots will focus their attention on
the HUD symbology to the extent that they might not perceive the few visible
approach lights at decision height. Pilots who do not pick up the out[1]side
cues may thereby initiate a go-around when the approach actually could have
been continued, an outcome that is not desirable from an operational stand[1]point.
The effect of HUD on touchdown performance for two different
approach lights conditions as defined in the European regulations:
F Full Approach Light facilities (≥ 720 m) and
b Intermediate
Approach Light facilities (420 to 719 m; JAA, 2004b).
EXPERIMENT 1
Experience on the B–737–700 varied from 50 hr to more than
1,000 hr.
It was used a CAE B–737–700 training simulator with aircraft
aerodynamics and visual angles valid for B–737–700 to collect data. This
six-axis full-motion simulator is approved for low-visibility operations down
to an RVR of 200 m. The simulator’s visual system had a field of vision of
180°/40° with a focal distance greater than 10 m.
Forty-eight pilots from a major European airline volunteered
to participate. All were qualified to fly the B–737–700 aircraft and had
completed their HUD training for the operator. The HUD training sessions consisted
of 1 day of theory and two simulator sessions of 4 hr duration each.
The HUD provided conformal display of flight path (velocity)
and flight-path guidance. The flight path was displayed as a circle with
slanted wings. Flight-path guidance was displayed in the form of a ring inside
the flight-path symbol.
Flight-path guidance was not available in the conventional
head-down instrumentation.
Each pilot manually flew two approaches using standard
operating procedures of the airline. The scenarios started as a 6 nm final to
the runway in lower than standard or standard RVR in a simulated 10 kt left
crosswind. In the with-HUD condition, the pilots kept the aircraft on lateral
and vertical by following the flight-path guidance ring with the flight-path
symbol on the HUD. At 50 ft above the runway threshold, the guidance cue was
automatically removed and the pilots performed the landing flare using external
visual cues in conjunction with the HUD flight-path symbol. The HGS–4000® IMC
mode incorporating automatic removal[1]of
the guidance cue was deliberately chosen to ensure that the pilots could not
attend solely to the HUD symbology in the with-HUD conditions.
In the no-HUD condition the pilots kept the aircraft on
lateral and vertical track by following the flight director bar guidance. At
decision height they continued the approach and landing using the external cues
only.
Touchdown performance
11 of the 48 pilots con[1]ducted one or two go-arounds. The simulator
failed to capture the location of the landing footprint for another 7 pilots.
As a result the data set for comparing the touchdown footprints across the HUD
and no-HUD conditions consists of 30 pairs of approaches. Of these 30, 15 were
flown using the HUD in the first approach and 15 using the conventional
head-down instruments (no-HUD) in the first approach;
15 were flown in standard RVR (550 m) conditions and 15 in
lower than standard RVR conditions (450 m).
Lateral touchdown performance was measured as the absolute
lateral deviation from the runway centerline at touchdown.
EXPERIMENT 2
Approaches in Experiment 2 were flown to simulations of a
runway with 420 m of approach lights. This length falls within the intermediate
facilities category of approach lights as defined by European aviation regulations
(JAA, 2004b).
Each participant flew one approach with HUD and one approach
without HUD to a runway with a system of approach lights of 420 m length. The
between-subject variable was RVR at two levels, a standard minimum RVR (700 m)
for intermediate facilities and a lower than standard minimum RVR (550 m to 600
m).
Forty-five [45] pilots from the same major European airline volunteered
to participate. None of the volunteers had participated in Experiment 1. All were
qualified to fly the B–737–700 aircraft and had completed their HUD training for
the operator. Experience on the B–737–700 varied from more than 50 hr to more than
1,000 hr.
Each of the 45 pilots attempted two approaches.
Thirty-two made two successful landings, one with HUD and
one without. Four pi[1]lots
made go-arounds in both conditions. Three pilots landed with the HUD and made
go-arounds without the HUD; six pilots landed without the HUD and made go-arounds
with the HUD.
Touchdown performance
As a result, the data set for comparing the touchdown footprints
across the HUD and no-HUD conditions consists of 28 pairs of approaches. Of
these 28 pairs of approaches, 9 were flown using the HUD in the first approach
and 19 using the conventional head-down instruments (no-HUD) in the first
approach; 14 were flown in standard RVR (700 m) conditions and 14 in lower than
standard RVR conditions.
As in Experiment 1, the effect for HUD use on the lateral
component of the touch[1]down
footprint is strong, F(1, 26) = 14.9, p < .001, η2 = .10, indicating a power
greater than .70. Once again, landings were closer to the centerline when
pilots used the HUD.
Three findings:
111. HUD use
per se did not influence the pilots’ decision to land or go-around at the
decision height.
The lack of an effect of HUD suggests that
the additional information in the HUD did not distract the pilots’ attention or
interfere with their decision making during the most critical portion of the
approach and landing sequence.
2.2.HUD use
significantly reduced the size of the lateral component of the touchdown
footprint for all RVR conditions.
The difference between the HUD and the no-HUD
conditions lay in the presence of a conformal flight-path vector in the pilots’
primary field of view during the landing.
3.3.In
contrast to its effect on the lateral component of the touchdown footprint, it
appears that the HUD did not influence the size of the longitudinal footprint.
The ubiquitous and ever-varying direction and velocity of wind is likely to preclude the development of true automaticity at touch[1]down. Crosswinds introduce an element of uncertainty regarding drift (the shift in lateral location of the aircraft relative to the runway’s centerline). For the pilot to detect drift the visual ground segment needs to be long enough to determine the aircraft’s movement over the ground. That means that to detect drift at all, a notice able lateral displacement must take place and not all of this displacement can be corrected before touchdown.
The HUD largely eliminates uncertainty about drift.
The addition of a conformal flight-path vector projected over the runway provides instantaneous feedback about aircraft drift and actual flight path. The additional information enables precise control of the flight path during approach and landing and reduces the variance in lateral displacement practically to nil.
Control of the longitudinal component of the touchdown footprint is largely an effect of how pilots handle the aircraft’s energy (operationally manifested as sink rate) in the final seconds before landing. The pilot uses information provided by the optic flow from the looming runway to control the aircraft’s energy (Lee, 1974). It is important to note that pilots of large commercial air transport aircraft are also aided by radio altimeter callouts that count down from 50 ft to 0 ft (runway contact) in 10-ft decrements.
The initiation of the landing flare has been shown to be a
function of time to contact (Mulder, Pleijsant, van der Vaart, & van
Wieringen, 2000). A small change in the timing of a landing flare at the nominal
glide slope of 3° results in large longitudinal differences. The HUD mode used
in the experiments provided no flare guidance and no additional information
that could be used to guide the pilots when to initiate the landing flare.


